Definition
Stock Volatility is the measurement of how much a stock moves up and down in a given amount of time. The more volatile the stock, the more “movement” you will see in its stock chart.
Example
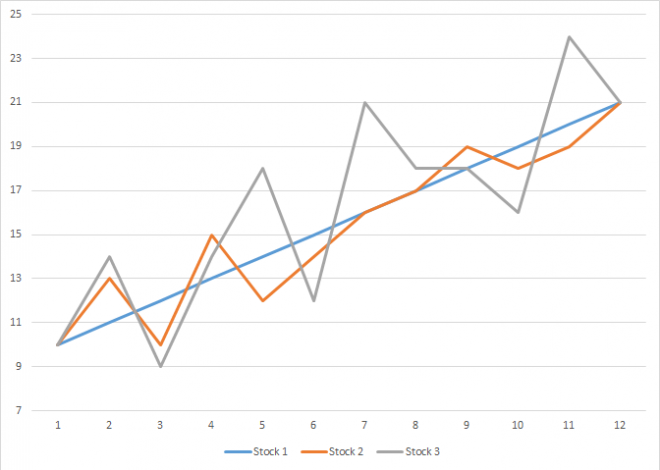
Consider the following 3 stocks:
All 3 of these stocks had the same growth rate between period 1 and period 12, but they had very different volatility.
Stock 1 was the least volatile, growing at a constant rate throughout the entire time.
Stock 2 was in the middle, it moved up and down but was fairly consistent.
Stock 3 was very volatile, with huge swings up and down over time.
How Do We Use It?
How you treat volatility depends on how you see yourself in the stock market. The average investor, who makes fairly few trades and is just trying to make their savings grow, does not like volatility, since they want consistent returns over time. Traders, who often trade multiple times per day, are trying to always “buy low and sell high”, so stocks that move up and down a lot are the best place to make profit.
However, a few bad trades, where a trader accidentally “sells low and buys high” can cause huge losses. For this reason, most investors concerned with “Capital Preservation” try to avoid volatility.
For more information on volatility, and how it affects your portfolio, read about the Sharpe Ratio (Beginner).


 Stock Symbols
