Definition
In Economics, “Supply” means the relationship between prices and production. In general, the higher the market price of a good or service is, the more producers are willing to sell of it.
Details
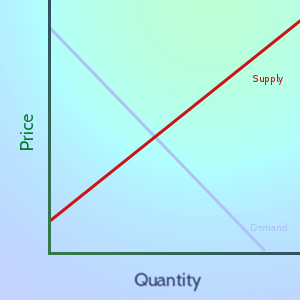
As the market price for a good goes up, companies want to sell more of it to try to make greater profits. Conversely, as the market price goes down, companies are less interested in production, and so the quantity supplied generally goes down.
Take a look at the graph on the right – notice that the “Quantity” does not start going up until the “price” gets above a certain point. This is because companies will not start producing something until the market price is at least as high as the cost of making it. As the market price goes up, the potential for profit also goes up, so companies are willing to put more resources into the production of this good, and the quantity supplied increases.
Difference Between “Supply” and “Quantity Supplied”
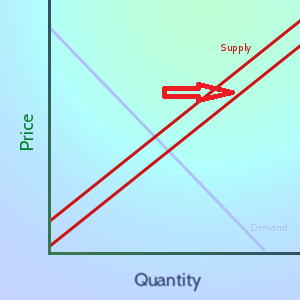
“Supply” refers to the relationship between the price and quantity – in our graphs, the “Supply” means the entire red line. The quantity supplied is a single point on that line.
This means that a change in “supply” means the entire line has moved, while a change in the “quantity supplied” means that the quantity has moved to a different point on the same line (due to a change in Demand).
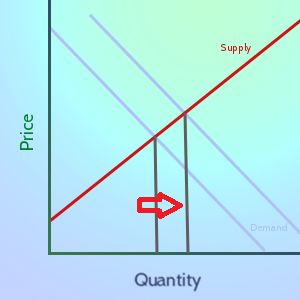
An increase in Supply usually means there was a fundamental shift in how the good is produced. A new manufacturing technique that saves on cost, subsidies from the government, or the cost of inputs becoming cheaper can all cause an increase in supply.
In contrast, new government regulations, an increase in the cost of inputs, or increased wages for workers (assuming they do not become more productive) will all cause supply to decrease.
The Quantity Supplied, on the other hand, can move because of both shifts in Supply and Demand. As you can see on the graphs above, an increase in supply will cause the price to decrease and the quantity supplied to increase, even if demand does not increase.
However, if demand increases (meaning more goods are demanded at the same price), the quantity supplied will also increase, even though the supply line itself stays the same.
Examples With The Stock Market
The stock market is a perfect example of seeing both changes in Supply and changes in Quantity Supplied in action.
Imagine there is a stock that 10 people currently own. Each of them has a price they would sell their stock for, if someone offered.
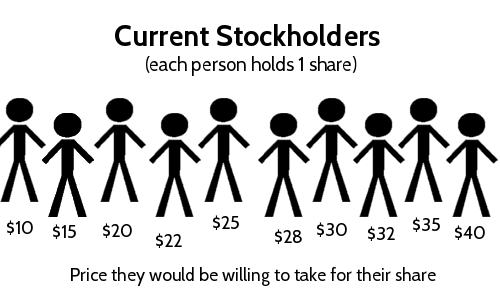
This would then be the supply line for this market:
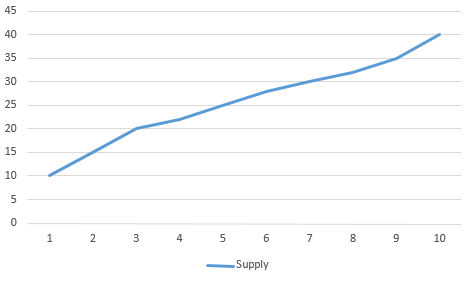
The actual quantity supplied will depend on what price buyers are willing to pay. Now lets consider a real example – what if all of these people had a share of Twitter stock (symbol: [hq]TWTR[/hq])? We can find out by getting a quote from the Trade page:

This quote tells us a lot about the supply, and what would happen in this case. The “Last Price” is $15 – that is because the market price was high enough for our lowest two suppliers to sell their share.
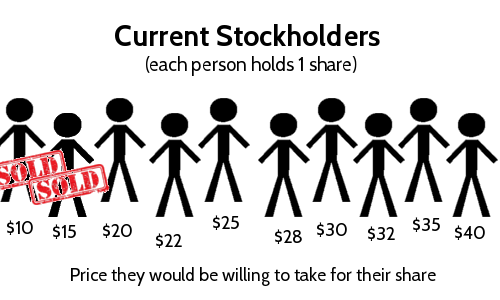
If we look at the “Bid/Ask”, we can also see that the most a buyer is willing to pay (the “bid” price) is now $17.89. We also see that the “Ask” price is now $20, which is the lowest amount that a seller is willing to take for their share.
This means for today at the market equilibrium price, the quantity supplied is 2.
 The Flag & Pennant Pattern
 Asset
Asset Sidechains: Scalability on Top of Bitcoin’s Network
