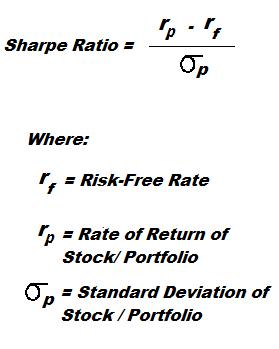
Definition:
The Sharpe Ratio, named after Nobel laureate William F. Sharpe, measures the rate of return in association with the level of risk used to obtain that rate. It’s a particularly useful tool for novice investors to use as a method tracking “luck” versus “smarts.”
Here’s an easy example to help conceptualize how the Sharpe Ratio works in real life. You and your two friends are out for a drink when the topic turns to investing. Friend number one is the play it safe guy who puts his money in Treasury Bonds and hopes for the best. Essentially his investment is as close to risk free as possible (excluding the threat of inflation of course). It’s safe and requires nothing more than automatic payroll deductions to generate a steady – albeit decidedly insignificant – rate of return. This is considered a “risk free” rate. Since anyone can obtain that rate of return by doing almost nothing, it is removed from the equation. Stocks, by their very nature, have some element of risk and as a rule of thumb, any investment with an element of risk should generate a premium above the risk free level…otherwise, why put your money at stake?
Friend number two is telling you about his hot new investment tip that just generated an amazing 25 percent rate or return. Is this guy a genius or what? Maybe not. By using the Sharpe Ratio, you can measure whether your friend is taking on too much risk. Briefly, it works like this… Subtract the risk free rate (like that available from your friends Treasury bills) from the rate of return generated then divide by the standard deviation of the portfolio returns. The result provides a way to measure the excess return derived from the level of risk assumed…not necessarily insight and intuition. Chances are your friend isn’t a genius but rather a lucky hot-shot who needs to take the money and run before his luck runs out. To give you some insight, a ratio of 1 or better is considered good, 2 and better is very good, and 3 and better is considered excellent. One final note: if your investment portfolio isn’t performing above the risk free rate then it’s time to put up or shut up. Either figure out what you are doing wrong and begin educating yourself on the basics of investing or sign up for those bonds via payroll deduction and hope inflation leaves you a little to live on by retirement.
What does the Sharpe Ratio Mean?
The Sharpe Ratio shows the excess return from the excess risk taken by an investor.
3-Month Return = 22%
Standard Deviation = 1%
Sharpe Ratio for AAPL = (0.22 – 0.03)/(0.01) = 19 Stock B = Google (GOOG)
3-Month Return = 24%
Standard Deviation = 2%
Sharpe Ratio for GOOG = (0.24 – 0.03)/(0.02) = 10.5
(i) Since both stocks had Sharpe Ratios greater than Zero, It was better to invest in one of them than to save the money at ING at 2%.
(ii) Even though GOOG had a slightly higher return that AAPL (24% > 22%), it would have been wiser to invest in AAPL as AAPL had a higher excess return per unit of risk than GOOG (19 > 10.5).
Practice this on HTMW
You can calculate your own Sharpe Ratio on stocks after trading it on:
Limitations of Sharpe Ratio
The limitation of the Sharpe Ratio is that it just tells you that one investment was better than the other comparing risk, but does not tell you HOW MUCH better that investment was. In other words, there are no units to measure the added benefit from choosing one investment over another.
Conclusion

The Sharpe Ratio is a useful tool to evaluate the actual risk-adjusted performance of a stock or portfolio compared to another. It shows us which investment is better if we want to maximize our returns while minimizing our risk.
Click Here for instructions on calculating the Sharpe Ratio for your portfolio yourself in Excel
 Markets Pilot Review | Uncovering the Pros & Cons Involved
 How to Start Investing in Stocks
 Diamond Bottoms
