Definition:
A stock quote represents the last price at which a seller and a buyer of a stock agreed on a price to make the trade. Because stock prices are determined by a continuous auction process between buyers and sellers, stock prices change frequently as the buyers and sellers change. Prices also change as new information about that company, that industry, or the economy becomes public; this new information then changes buyers and sellers expectations of the stock’s future performance.
Details
Usually when you get a stock quote, you see lots of other information about that company and that stock price. The most important thing to note is the time-stamp that shows you how old the stock quote is. The other important pieces of information a stock quote shows is the day’s high, low and volume, and sometimes the 52-week high and low.
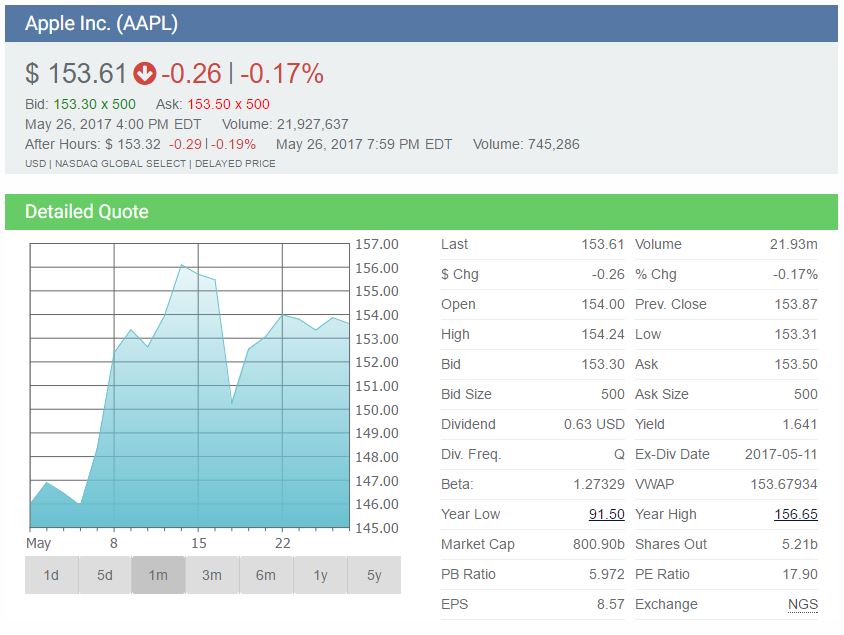
Take a look at the quote of Apple. You will see at the upper right this quote is from 4:00 PM ET on May 26, 2017. The last traded price was 153.61, which is down $0.29 from yesterday’s close, and the day’s trading range is a low of 153.31 and a high of 154.24. IMPORTANT: NOTE THE OPEN PRICE OF $154.00 — STOCKS RARELY OPEN TRADING AT THE SAME PRICE THEY CLOSED AT THE DAY BEFORE.

The Stock Chart
After noticing the price and the daily high, low, and volume, take a look at the stock chart. The chart above shows the stock chart for the last month. Also click on the 1 Day, 5 Day, 3 Month and 1 Year links to see those charts. It is always important to get a sense not only of what the stock price is doing today, but to also look for the short and longer term trends.
The Dividend Rate, Dividend Yield, and Ex-Div Date
Companies that are consistently profitable often pay out part of their earnings to shareholders. This is called a dividend. In the image above, Apple pays out $0.63 per share per quarter. The Dividend Yield is the percentage of the stock’s price that is paid out in dividends per year, so we can calculate that the $0.63 quarterly dividend is $2.52 annually. When the stock is at $153.61 then getting that payment of $2.52 is a 1.641% dividend yield. The Ex-Div Date is the date the last payment was based on. You had to be a shareholder at the close of business the previous day to get that dividend. Most companies pay dividends quarterly but list the annual amount.
Bid and Ask Price
When looking at a stock quote, also notice the Bid Price and the Ask Price if they are shown. The Bid Price is the highest price a buyer is willing to pay for the stock; the Ask Price is the lowest price a seller is willing to sell the stock. If you place a Market Order to buy the stock, your order will get executed closer to the Ask Price. If you place a Market Order to sell the stock, your order will get executed closer to the Bid Price.

Prices shown are often delayed 15 minutes because of stock exchange rules.
Pricing Increments
Stock prices used to be quoted in fractions like “$116 and a half”, or “53 and 3/4” with the lowest increment of an 1/8th of a dollar (which is 12.5 cents). But now most exchanges only use decimals and allow stock prices to be quoted in pennies (and sometimes 1/10 of a penny). Stock quotes can either be in real-time or with a specified delay (like a 15-minute delay).
Stock Quote Components
Financial papers, web sites or newsletters have stock quotes that look something like those in the image below:
Columns 1 & 2: 52-Week High and Low – These are the high and low prices a stock was traded over the prior 52 weeks (one year period).
Column 3: Company Name & Type of Stock – This column provides the name of the stock’s company. If the name does not have special symbols or letters, it is common stock. Different special symbols imply different classes of shares. For example, “pf” would mean that the shares are a preferred stock.
Column 4: Ticker Symbol – A stock symbol or ticker symbol is an abbreviation used to uniquely identify publicly traded shares of a specific company’s stock on a particular stock market/exchange. A stock symbol may consist of letters, numbers or a combination of both.
Column 5: Dividend Per Share – This indicates the amount of money that a company pays per share. If it is blank, the company does not pay dividends to its stock holders.
Column 6: Dividend Yield – The percentage return to the stock owners in dividend per year. You can calculate it by dividing the annual dividends per share by the price per share.
Column 7: Price/Earnings Ratio – You can calculate this by dividing the stock price by current earnings per share from the last year. This is also called a P/E Ratio.
Column 8: Trading Volume – This is the total number of shares traded for a specific day, listed in hundreds. Of course you can figure the actual number traded by adding “00” to the end of the number.
Column 9 & 10: Day High and Low – This shows the daily highest price and lowest price that someone paid for the stock.
Column 11: Close – The close is the last trading price when the market closes. If the entire listing is BOLDED, then the price is UP or DOWN more than 5% from the prior day’s closing price.
Column 12: Net Change – This is the change in value for the stock price since the previous day’s closing price. When you hear that a stock is “up for the day,” it means that the price increased for the day.
Quotes on the Internet
Today most people get their stock quotes from the Internet. You can get a lot more information online than you can get from the newspapers. Many sites like www.HowTheMarketWorks.com now offer historical financial statements, Wall Street analysts’ ratings, SEC filings, and amazing charting capabilities. You can try out the HowTheMarketWorks quotes tool by entering any ticker symbol in the blue box on the right side of this page.
Click here to see all Beginner Stock Trading Articles

 TheStreet.com
